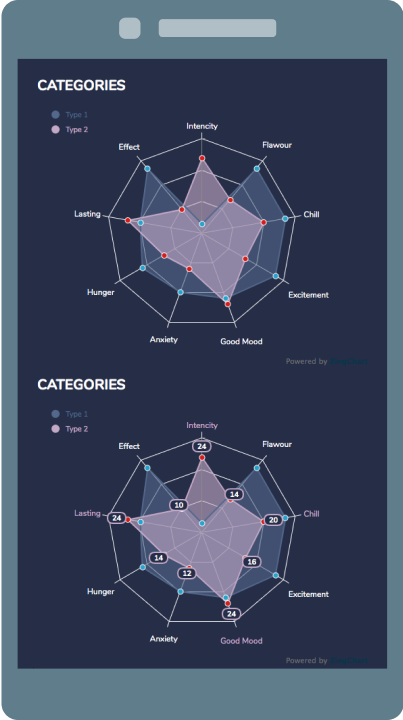
Bring the data in your Vue apps to life with ZingChart's powerful JavaScript API & built-in features using the official Vue component for ZingChart.
We've created a 3-part tutorial series to show you how to build an interactive dashboard using the ZingChart Vue component.
Whether you’d like to use the free branded version of ZingChart, or are looking to integrate ZingChart into your next OEM commercial project – take a look at our licensing options to see what’s right for you.
View Licensing OptionsCharts are a necessity in most apps, regardless of the industry you're developing for, so you'll usually need at least one chart to visualize industry-specific data.
ZingChart gives developers like you an all-in-one solution that's robust enough to handle most charting challenges, including those involving big data. Check out the following blog posts to learn about the different web development use cases that ZingChart is suited for across different industries.

1. Install via NPM
					$ npm install zingchart // Only if you have not already done so
$ npm install zingchart-vue
2. Register the component in your app
import Vue from 'vue';

// import the es6 version
import 'zingchart/es6';
// import the component AFTER ZingChart since it is a DIRECT dependency
import zingchartVue from 'zingchart-vue';

Vue.component('zingchart', zingchartVue);
3. Add the component to your markup
<zingchart :data="myConfig" :height="300" :width="600"/>
4. Define your chart configuration in your app
export default {
  data() {
    return {
		myConfig: {
				type: 'line',
				series: [{
					values: [43,23,54,54,39,47,38,59,39,49]
				}]
		}
    }
  }
}